Importance of Chart patterns
Some chart patterns, like head and shoulders or triangles, have historically demonstrated a high degree of reliability. This historical performance can provide traders with confidence in their analysis. owever, it's important to note that chart patterns are not infallible. Market conditions can change, and not all patterns will result in the expected price movements. Therefore, it's essential to use chart patterns as part of a broader technical analysis strategy, incorporating other indicators and tools for a comprehensive understanding of market dynamics.
Visualization
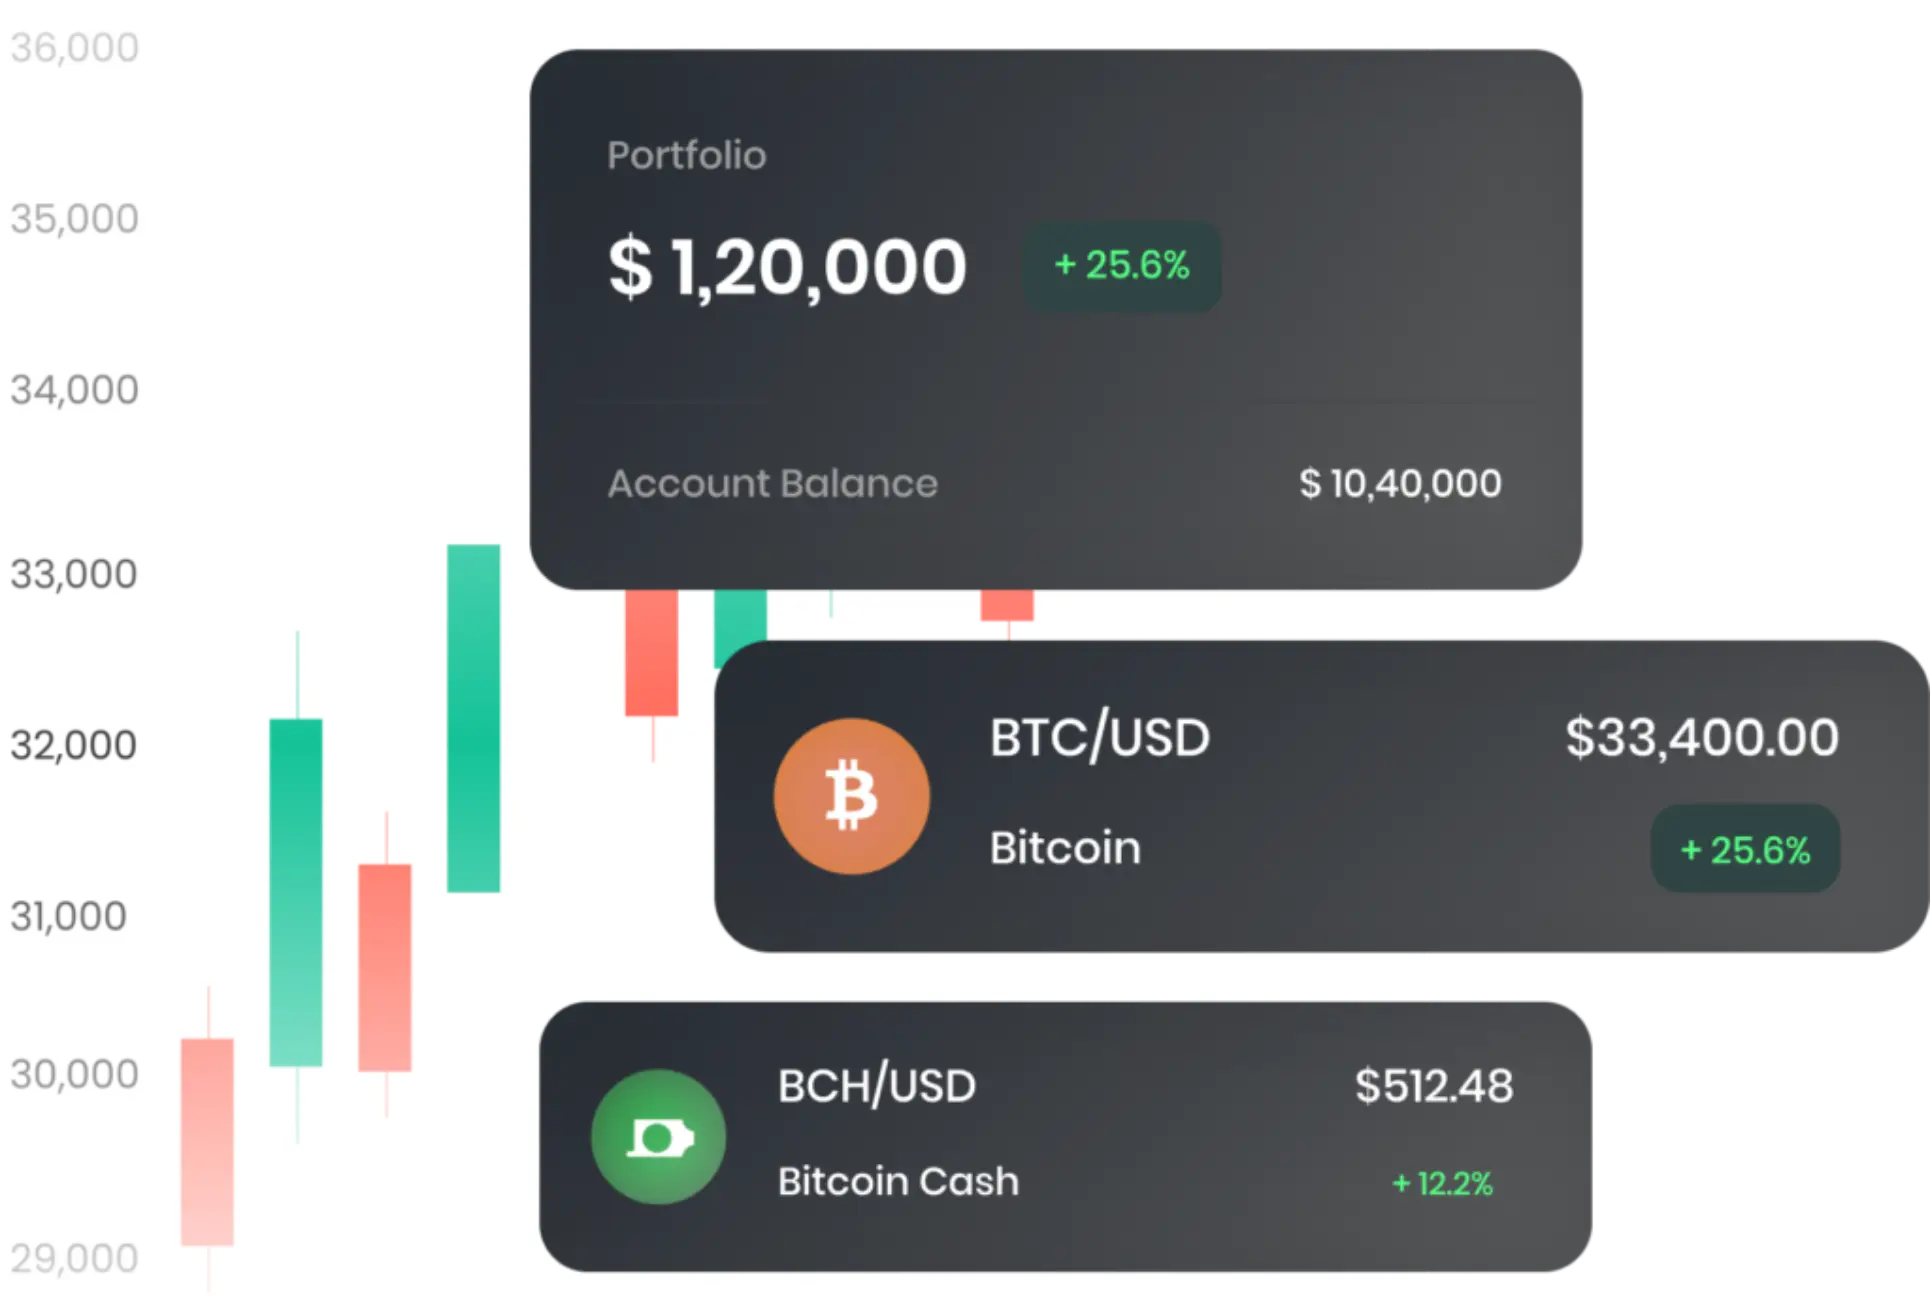
It provide a visual representation of price movements, making it easier for traders to spot trends and anticipate potential price movements.
Market Sentiment
For instance, a cup and handle pattern forming after an extended downtrend might indicate a shift in sentiment and a potential bullish reversal.
Pattern Quality
The balance in the pattern's form, where both sides exhibit an almost identical shape and size, indicates robustness.
Time Frame
Patterns visible on short-term charts might carry lower reliability compared to those apparent on long-term charts.
Power of Chart Patterns
Chart patterns are powerful visual representations of historical price data. By recognizing and understanding these patterns, traders and investors gain insights into potential future price movements. The power of chart patterns lies in their ability to help forecast market direction and assist in making informed trading decisions.Continuation patterns, such as flags, pennants, and triangles, suggest that the prevailing trend is likely to continue.
Overview of Chart Patterns
Risks and Considerations in Chart Pattern Analysis
Chart patterns are graphical representations of historical price movements of financial instruments, primarily used by technical analysts to make predictions about future price movements. These patterns are formed on the price charts of stocks, commodities, currencies, and other tradable assets.
Reversal Patterns
It consists of three peaks; the middle peak is the highest and the other two form the shoulders.
Continuation Patterns
Flags and pennants are small consolidation patterns that form after strong price movements.
Price Gaps
These are gaps that occur in the price chart due to a change in trading activity. filled relatively quickly.
Bilateral Patterns
These patterns don't provide a directional bias and can result in either a continuation or reversal.

Why is it important
Set goals. Accomplish. Improve.
For continuous improvement, consult with our expert team to meet current goals and set new ones. The evolving digital market requires constant monitoring and adaptation for a strong brand position.
Cultivating Your Dreams
Fostering the growth of your aspirations
Fostering the growth of your aspirations means nurturing and cultivating your dreams in order to see them come to fruition. It's about actively and intentionally working towards the achievement of your goals, rather than passively hoping for success.


